1 Introduction
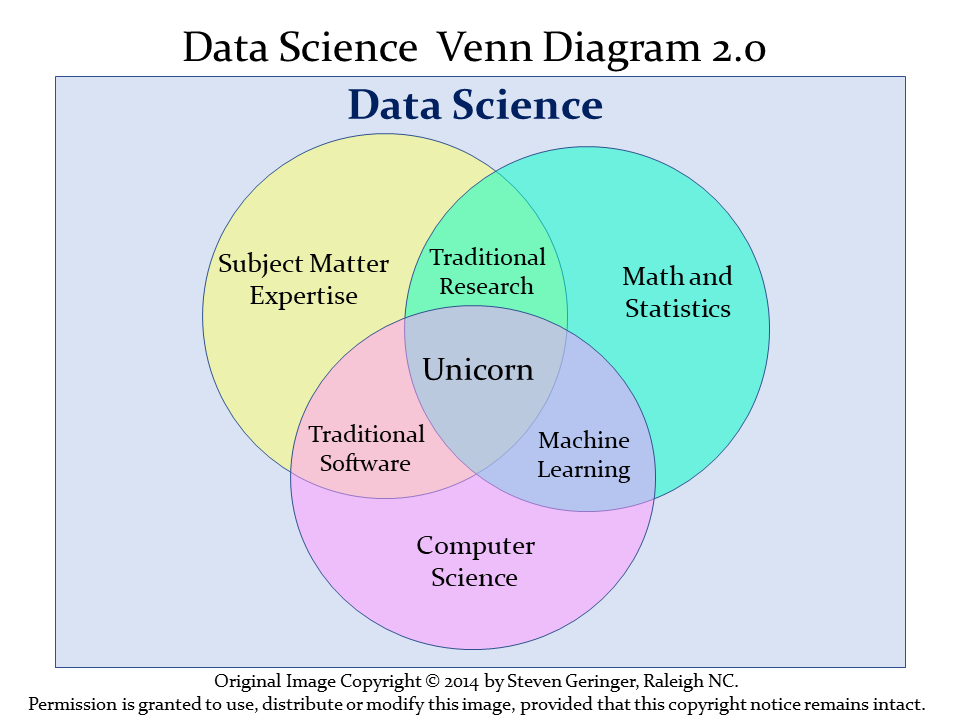
The definition of data science can be a little slippery. One fairly modern view of data science is exemplified by Steven Geringer’s 2014 Venn diagram.
- The field encompasses ideas from mathematics and statistics and from computer science, but with a heavy reliance on subject-matter knowledge. In our case, this includes clinical, health-related, medical or biological knowledge.
- As Gelman and Nolan (2017) suggest, the experience and intuition necessary for good statistical practice are hard to obtain, and teaching data science provides an excellent opportunity to reinforce statistical thinking skills across the full cycle of a data analysis project.
- The principal form in which computer science (coding/programming) play a role in this course is to provide a form of communication. You’ll need to learn how to express your ideas not just orally and in writing, but also through your code.
Data Science is a team activity. Everyone working in data science brings some part of the necessary skill set, but no one person can cover all three areas alone for excellent projects.
[The individual who is truly expert in all three key areas (mathematics/statistics, computer science and subject-matter knowledge) is] a mythical beast with magical powers who’s rumored to exist but is never actually seen in the wild.
http://www.kdnuggets.com/2016/10/battle-data-science-venn-diagrams.html
1.1 Data Science Project Cycle
A typical data science project can be modeled as follows, which comes from the introduction to the amazing book R for Data Science, which is a key text for this course (Wickham, Çetinkaya-Rundel, and Grolemund 2024).
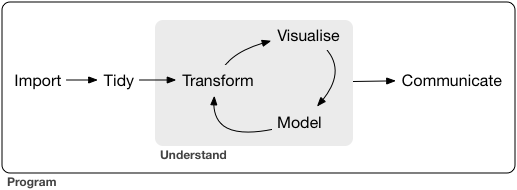
This diagram is sometimes referred to as the Krebs Cycle of Data Science. For more on the steps of a data science project, we encourage you to read the Introduction of Wickham, Çetinkaya-Rundel, and Grolemund (2024).
As Gelman, Hill, and Vehtari (2021) suggest, statistical analysis itself cycles through a series of steps:
- Model building, starting with simple linear models of the form \(y = a + bx\) + error, and expanding through additional predictors, interactions and transformations.
- Model fitting, which includes data manipulation, programming, and the use of algorithms to estimate regression coefficients and their uncertainties and to make probabilistic predictions.
- Understanding model fits, which involves graphics, more programming, and an active investigation of the (imperfect) connections between measurements, parameters, and the underlying objects of study.
- Criticism, which is not just about finding flaws and identifying questionable assumptions, but is also about considering directions for improvement of models. Or, if nothing else, limiting the claims that might be made by a naive reading of a fitted model.
The next step is to return to model building, possibly including new data.
1.2 Data Science and the 431 Course
We’ll discuss each of these elements in the 431 course, focusing at the start on understanding our data through transformation, modeling and (especially in the early stages) visualization. In 431, we learn how to get things done.
- We get people working with R and R Studio and Quarto, even if they are completely new to coding. A gentle introduction is provided at Ismay and Kim (2024)
- We learn how to use the
tidyverse(see http://www.tidyverse.org/), an array of tools in R (mostly developed by Hadley Wickham and his colleagues at R Studio) which share an underlying philosophy to make data science faster, easier, more reproducible and more fun. A critical text for understanding the tidyverse is Wickham, Çetinkaya-Rundel, and Grolemund (2024). Tidyverse tools facilitate:- importing data into R, which can be the source of intense pain for some things, but is really quite easy 95% of the time with the right tool.
- tidying data, that is, storing it in a format that includes one row per observation and one column per variable. This is harder, and more important, than you might think.
- transforming data, perhaps by identifying specific subgroups of interest, creating new variables based on existing ones, or calculating summaries.
- visualizing data to generate actual knowledge and identify questions about the data - this is an area where R really shines, and we’ll start with it in class.
- modeling data, taking the approach that modeling is complementary to visualization, and allows us to answer questions that visualization helps us identify.
- and last, but definitely not least, communicating results, models and visualizations to others, in a way that is reproducible and effective.
- We also use the
easystatscollection of R packages (Lüdecke et al. 2022) (see https://easystats.github.io/easystats/) to help us with modeling and reporting key elements of our statistical work. This framework builds on what the tidyverse does to help us in the final stages of preparing an analysis, as we’ll see. - Some programming/coding is an inevitable requirement to accomplish all of these aims. If you are leery of coding, you’ll need to get past that, with the help of this course and our stellar teaching assistants. Getting started is always the most challenging part, but our experience is that most of the pain of developing these new skills evaporates by early October.
1.3 What The Course Is and Isn’t
The 431 course is about getting things done. In developing this course, we adopt a modern approach that places data at the center of our work. Our goal is to teach you how to do truly reproducible research with modern tools. We want you to be able to collect and use data effectively to address questions of interest.
The curriculum includes more on several topics than you might expect from a standard graduate introduction to biostatistics.
- data gathering
- data wrangling
- exploratory data analysis and visualization
- multivariate modeling
- communication
- both Bayesian and frequentist approaches to regression models
It also nearly completely avoids formalism and is extremely applied - this is absolutely not a course in theoretical or mathematical statistics, and this book reflects that approach.
Our work does not require highly advanced mathematics. There’s very little of the mathematical underpinnings here:
\[ f(x) = \frac{e^{-(x - \mu)^{2}/(2\sigma^{2})}}{\sigma{\sqrt{2 \pi }}} \]
Instead, this book and course focus on how we get R to do the things we want to do, and how we interpret the results of our work. Prior programming knowledge is desirable in some ways, but by no means required.
In 431 (and its follow-up, 432), we hope to provide you with the tools you need to work effectively with regression models. This includes understanding, using and assessing the fit of linear models (in 431) and generalized linear models (in 432) incorporating a wide range of ideas. We want you to understand what regression can and cannot do, and we want you to have a deeper sense of how to get started (and when to stop) with a regression analysis. Note that some of our motivation for the revisions found in this book as compared to prior versions of 431 comes from Gelman, Hill, and Vehtari (2021).
I should also mention that this isn’t a book about big data, by which I mean data that can’t fit easily into a single analytic file residing on a laptop computer. We work with small and medium-sized data files here, and will do so throughout 431 and its follow-up course, 432.